The new Epix Pro series is here, finally bringing the Epix AMOLED display-enabled watch to the same three sizes as the Fenix lineup (42mm, 47mm, and 51mm). But that’s not the only change. All three editions now gain a flashlight feature on the front of the watch, a new optical heart rate sensor package, new Hill Score and Endurance Score stats, and a number of other changes including even better battery life, and multiband-GNSS now being standard.
Oh, but it’s not just the new Epix Pro today, but also the new Fenix 7 Pro – which essentially matches all the changes of the Epix Pro in terms of new features/hardware, but with the long-battery lasting MIP display instead of AMOLED. Check out that full in-depth review over too!
As usual, I’ve been putting these watches through their paces. From crazy long trail runs from sea level to the top of an 8,000ft mountain, to doing an Ironman 70.3 race last weekend, to everything in between. And alongside that, my wife has been taking out the smaller edition Epix Pro 42mm sized unit in her long-distance training, as well as the smaller 42mm Fenix 7S Pro.
Finally, note that Garmin sent over a media loaner to test out. As usual, this review is not sponsored (nor does any company get to preview anything I review), and I don’t take any advertiser money from any companies I review. Once this unit goes back, I’ll go out and buy my own for any future testing needs. If you found this review useful, you can use the links at the bottom, or consider becoming a DCR Supporter, which makes the site ad-free, while also getting access to a mostly weekly video series behind the scenes of the DCR Cave. And, of course, it makes you awesome.
What’s New:

As is often the case when Garmin adds a ‘Pro’ or ‘Plus’ moniker to an existing product, it represents an in-between upgrade cycle. Meaning, this is not named the Epix vNext or whatever for a reason. Just like it’s named the Fenix 7 Pro, and not the Fenix 8. Garmin sees these as largely incremental upgrades – all new software features are being ported back to the existing Fenix 7 series and Epix units (except the watch faces that say ‘Epix Pro’ or ‘Fenix 7 Pro’ on them). Still, there will undoubtedly be some of you that are going to upgrade from a Fenix 7 to a Fenix 7 Pro. Or from the existing Epix to the Epix Pro, purely for hardware reasons. And for those of you, here are those specific differences:
– Now three sizes of Epix: 42mm, 47mm, and 51mm (exact same case sizes as Fenix 7 series)
– All three sizes now have a flashlight/torch (previously only the Fenix 7X, Enduro 2, Tactix 7, and Instinct 2X had it)
– Completely new optical HR sensor – Garmin Elevate V5
– Epix Pro has physical hardware for ECG, but is not yet enabled/certified for it (meaning, no ECG today, and no promise of it either)
– Added even bigger physical battery to Epix Pro 51mm (the larger Enduro 2 battery, to be specific)
– Added new ‘Redshift’ mode (makes screen red-only)
– Added multiband/dual-frequency GNSS as standard/base (previously just Sapphire)
– Increased storage to 32GB on all models as standard/base (previously just Sapphire)
– Added faster charging (now about 1hr, instead of nearly 2hrs before)
– Added Endurance Score metric
– Added Hill Score metric
– Added weather overlays on maps (precip, temp, wind, clouds)
– Added shaded relief on all maps
– Added new split screen data pages (map + data fields split vertically)
– Added new ‘perimeter’ data pages (data around edge of map)
– Added new ‘Recents’ feature to quickly access widgets anytime
– Added 30+ new activity/sport profiles (listed down below)
– Very slightly updated user interface (but not the newer Forerunner 265/965 one)
– Substantial bump in battery life on Epix Pro 51mm (the big one)
– Pricing stays same at $ 899USD for Epix base 42/47mm models (but now with extra hardware features), and $ 999 for the larger 51mm base model.
– Pricing stays same at $ 999USD for Epix Titanium-Sapphire models (not just material differences + pre-loaded maps), with the larger 51mm at $ 1,099
– They’ve also added a boatload of new QuickFit bands you can buy for each sized model (with new colors)
The big ticket item here is that the price actually stays the same for the base model, but now you get multi-band GNSS as well as the larger storage size. Meanwhile, Sapphire editions for $ 100 more gets you the Sapphire glass, and Garmin simply pre-loads more map regions. But you can download those same exact maps/regions yourself on the base unit using WiFi easily.
Oh, and here are all the newly added sports/activity profiles:
Basketball, Volleyball, Field Hockey,Ice Hockey, Football/Soccer, American Football, Lacrosse, Rugby, Ultimate Frisbee, Cricket, Softball Baseball, Ice Skating, Inline Skating, Archery, Overland, Whitewater, Kayak, Boxing, Mixed Martial Arts, Snorkel, BMX, Motocross, Table Tennis Squash, Racquetball, Badminton, Platform Tennis
This is a notable change in Garmin’s approach. Up till now, Garmin mostly only created sport/profiles when they had specific data metrics for each sport (e.g stroke rate while kayaking, or run length for water skiing). But that got to be more and more annoying when you wanted to simply use sport profiles for categorization purposes. It led me to use the cross-country skiing profile for outdoors ice skating this past winter, and others to use gym mode for basketball, and so on. All the while their competitors like Suunto and Polar offered tons of sports modes, albeit without the sport-specific data.
Now Garmin is going to split the difference. For some sport modes it’ll build-out those complex data metrics to back it (like it’s always done). Yet for others that people have been asking for, they’re creating sport profiles that at least allow you to categorize it correctly on-watch (and thus, on-platform later). Garmin says they’ll then take that usage data and figure out which sports they should invest further in, in terms of actual metrics/data. That approach seems…well…logical, if you ask me.
Next, here’s the full pricing charts for each mode, first the Epix Pro:
![Screenshot 2023-04-25 18.05.06_thumb[6]](http://media.dcrainmaker.com/images/2023/05/Screenshot-2023-04-25-18.05.06_thumb6_thumb.png "Screenshot 2023-04-25 18.05.06_thumb[6]")
And then the Fenix 7 Pro:
![clip_image001[5]](http://media.dcrainmaker.com/images/2023/05/clip_image0015_thumb.jpg "clip_image001[5]")
And then here’s the battery chart for both of them:

And again, as a reminder – every single software feature outlined above is coming to the existing Epix & Fenix 7 series units. Note that Redshift is only on Epix series units, not a Fenix 7 series display thing (either base or Pro models).
With that – let’s dive into the boxes.
In the Box:
Now, the box I have wasn’t final, though, the hardware is. As is often the case, companies (including Garmin) start making units and stock-piling the devices themselves far before final graphics get finalized and the boxes printed. Thus, when they made my box, they hadn’t quite decided on the final watch face yet. In my review video above, I creatively solved this problem with a sticker. But I was too lazy here.
In any case, here’s the box:

And here’s what’s inside: The watch, a USB-C Garmin charging cable, and some paperwork that tells you nothing of value.

Here’s what the unit looks like before I get dirty with it for a lot of miles:

And here’s how the three units look side by side – the Epix 42mm, Epix 47mm, and Epix 51mm. These are all the Sapphire editions.

And here’s how the displays left to right: COROS Vertix 2, Garmin Fenix 7, Suunto Vertical, Amazfit T-Rex Ultra, and Garmin Epix Pro (47mm):

Got all that? Good, let’s get into it.
The Basics:

This section is all about daily usage. Everything from the hardware basics like the display, buttons, and battery – to the 24×7 activity tracking, Jetlag Advisor, and more. Basically, everything except sport/navigation/music/payments/flashlight, which have their own sections.
To begin, the Epix follows the standard Garmin 5-button design, but with a full touchscreen display as well. Garmin’s approach for this layout is that you can do any function you want via either touch or buttons. If you hate touch, you never have to use touch. If you hate buttons, the only time you need buttons is to start/stop/lap an activity. Equally, if you love touch for daily use but hate it for sport, you can even disable it during sports. Or disable it for running but keep it for hiking. The world is your oyster here.
From a button standpoint, there are three buttons on the left, and two on the right. The left-side buttons are generally for navigating up/down menus, whereas the right-side ones are generally for confirming/lap/stop/start/back.


Next, there’s the AMOLED touchscreen on the Epix series. The touchscreen comes in three sizes, with the Epix Pro using the same display as the previous Epix:
– 42mm
– 47mm
– 51mm
The touchscreen works well in wet conditions for the most part, though it’ll struggle a bit if you have hard water streams like a shower nozzle directed towards it. But interestingly, it won’t tend to ‘go crazy’ in the shower, as Garmin appears to have some slight bit of logic that requires a more firm human touch before it starts reacting under water pressure. But for normal rain/sweat/etc. usage, no problems in typical rainy Amsterdam training, nor racing in the rain for 5.5 hours, or umpteen other water situations I’ve had with it:

As noted, you can enable/disable the touchscreen options in the system menu if you want. By default, the touchscreen is disabled for sport modes, but you can enable it across the board or on a per-sport profile basis. Or even just for maps only.

Much has been made of AMOLED displays over the last 18 months since the first-gen Epix units came out. A lot of that noise is from folks that have used older AMOLED/LCD panels – even from just a few years ago. Whereas newer AMOLED displays are easy to see/use in the sun – and excel even better in darker/dimmer conditions. Even when on Garmin’s default lower-brightness levels (which is how I use it). It’s simply not true that these AMOLED displays are hard to see in the sun. They simply aren’t. Here’s the AMOLED-based Epix Pro side by side with the Fenix 7 Pro (MIP-based display):


Note: The camera (without any editing) made the Fenix 7 Pro look waaaaay better than it actually does here. Seriously. It must have paid off my Nikon.
The singular area where AMOLED displays can be harder to see is if they aren’t activated. In my case, I use my Epix in an always-on display configuration. This means the display is, well, always on. However, the default is actually that the display turns off when your wrist is down. Then you raise your wrist and it turns on. But again, I just keep it always-on. But in that always-on configuration, if my wrist is down, it dims the screen. In that scenario, if the screen is dim and the wrist isn’t facing you – then yes, it’s not as easy to see.
But honestly, that situation just doesn’t really exist very often in real life. If I need to see my watch – any watch – I’m generally turning my wrist just slightly to see it. It’s kinda that simple – no matter the display type. This is probably a better representation of the two side-by-side:

Now, the other single area in sport where it can be more challenging is if you plan to mount your Epix on your bike handlebars. In that case, depending on how smooth the roads are, the watch will go to sleep when off-wrist after a period of time (under a minute). Albeit, on bumpy roads it never really goes to sleep. This is true of other AMOLED displays from other companies too – including Samsung, Apple, Fitbit, Google, and more. But more on that in the sport section.
For me, the very few edge cases where AMOLED is worse are far outweighed by all the cases where it’s far better – especially in dim lighting conditions (like indoors, or the entire time period of October to April in Amsterdam, where I live). Still, if you’ve tried current-gen AMOLED displays and it’s not your cup of tea, the Fenix 7 Pro is the exact same watch feature-wise with a MIP display instead.
In any case – let’s move along to some more basics. The watch face is fully customizable. Here I’m just showing the default watch face, but you can tweak any of the data bits on it (called complications), as well as download boatloads of 3rd party watch faces.

As always, I’ll point out I fail to understand the huge data inconsistencies between Garmin’s Forerunner & Fenix teams on watch face data fields. Why is it that some Garmin Forerunner watches allow data bits like Training Load/Recovery/Acute Load/etc., yet other Fenix watches don’t allow it? In my mind, the list of data fields I can use on stock watch faces should be massive. Instead, it’s trivially small. There’s no value in seeing VO2Max daily, but there is value in seeing Acute Load, or Hill Score, or Endurance Score, or Training Readiness, or any other data for that matter from the widgets (none of which are allowed). For all the new metrics Garmin keeps adding, none of them are actually available here. Why?
Once you press down from the watch face, you’ve got your widget glances. These are little snippets of information that can be opened for more detailed views of that topic. You can re-arrange these, put them in folders, add/remove them, add 3rd party ones, and so on.

Here you can see I’ve re-arranged things based on the most important ones to me. If I tap into one of them, like Training Readiness, I can see more information about that in a larger view.


This is really the same for all the core metrics as well, such as steps or sleep. You can see here the widget glance view, and then more detailed views within it.


And all of this is available via the Garmin Connect platform – either the smartphone app or the website. You can see some views of it here:

![clip_image001[6]](http://media.dcrainmaker.com/images/2023/05/clip_image0016_thumb-1.png "clip_image001[6]")
![clip_image001[8]](http://media.dcrainmaker.com/images/2023/05/clip_image0018_thumb-2.png "clip_image001[8]")
In terms of sleep tracking and accuracy, I’ve had no issues with the exact time I fell asleep/woke up being correct. Garmin continues to improve this, and it handles things like middle-of-night wake-ups for small children, without much problem these days.
As for sleep phases/stages, that’s not an area I typically judge. Mainly because the technology to baseline it against frankly sucks. Even the best comparative technologies are only about 80% accurate, and we’d never accept that kind of analysis when comparing heart rate data or GPS coordinates. So I’m not sure why I’d compare products to something that’s knowingly inaccurate (especially since here it’s a binary element of just one of four choices, so it’s not like HR where you’re inaccurate by 152bpm vs 155bpm – here the entire phase could be Deep Sleep instead of Light Sleep – drastically different). Equally, I also don’t put too much stock in the data here, though, that’s somewhat challenging since it’s used for components like Recovery and Training Readiness.
Me, the day after a no-sleep redeye-flight trying to catch up on sleep. Didn’t really work:


In addition, the Epix & Fenix 7 series both display HRV status. On Garmin devices this monitors your HRV values for the entire night constantly, and then simply averages them. You can see how this trends over the course of the night. The idea behind HRV status is to see how your body is reacting to various conditions – be it training fatigue, jetlag, sickness, or even drugs/alcohol. Generally speaking, you look for longer-term HRV trends – not just a single night.

Here, you can see Garmin noticing my trend, including the pickup that I’ve been travelling overseas, as to why my sleep has been crap the last week:

Garmin creates an HRV baseline over the course of 19 nights, so you won’t get the color coding until 19 nights are complete. That HRV baseline is unique/specific to you. You can see mine above. There are, of course, pros and cons to entire-night capture (versus doing it manually when you first wake up). On the pro side, the ‘easy-button’ factor is really high. It doesn’t require any work on your behalf. The downside is that you tend to ‘burn-off’ the effect of drinking or other stressors, which a morning-only value would sidestep. Except, those stressors have an impact on your sleep – so pretending they don’t exist is silly.
Anyways, the debate will continue to rage among HRV geeks as to which way is ‘best’, but for 99% of people, having a watch simply do it behind the scenes is going to produce more consistent and actionable results (no matter the brand).


Now, much of this data comes from the new Garmin Elevate V5 optical heart rate sensor on the back. You’ll see this new sensor now has more LEDs, designed to better handle workout types where your wrist may be bent in funky positions (like weightlifting). Further, it’s designed to handle inbound light leakage better (outside light is the arch nemesis of any optical HR sensor).

The optical HR sensor is responsible for more than just heart rate 24×7 and during workouts, but also a slew of other metrics like breathing rate, blood oxygenation levels (SpO2 aka PulseOx), HRV status, stress levels, and more. There are boatloads of metrics derived from it, and it operates every second, constantly recording. You can see just a small snippet of some of these metrics, which are mirrored both on various watch widgets, but also in Garmin Connect (Note: Blood Pressure here is coming from the Garmin BP-1 Blood Pressure Monitor):
![clip_image001[10]](http://media.dcrainmaker.com/images/2023/05/clip_image00110_thumb-2.png "clip_image001[10]")
![clip_image001[12]](http://media.dcrainmaker.com/images/2023/05/clip_image00112_thumb-2.png "clip_image001[12]")
![clip_image001[16]](http://media.dcrainmaker.com/images/2023/05/clip_image00116_thumb-2.png "clip_image001[16]")
Now many will ask about ECG. This new sensor and the Epix Pro/Fenix 7 Pro units do have the right internal hardware components for ECG. Specifically, it includes an isolation ring you can see around the sensor and metal contact against the skin near the sensor, as well as internal wiring to be able to use the upper right button when doing an ECG. At present, the only other watch from Garmin with such hardware is the existing Venu 2 Plus, which is certified for ECG usage (here’s how that works). However, at launch the Epix Pro & Fenix 7 Pro is NOT certified for ECG usage, and as such is not on the list of features by Garmin.

To be super clear here – while the hardware is capable of it (whereas the previous Epix/Fenix 7 didn’t have the hardware inside), Garmin, from an FDA compliance standpoint, legally cannot discuss any ECG plans on the Epix/Fenix 7, until the device is certified. Thus, if or when ECG gets lit up remains an unknown. Obviously, as Garmin has said previously on-record, they want to expand ECG access as much as possible. And given this unit has the hardware, it’s the certification aspect which remains outstanding.
Also, for lack of a better place to stash it, there is no skin temperature feature currently enabled on the Epix Pro or Fenix 7 Pro units. It wouldn’t surprise me if the sensor is capable of it (for a slate of reasons, especially around women’s health). But as of today, there is no skin temperature feature currently enabled on the watch.
Now switching topics and rounding out towards home, we’ve got smartphone notifications. The Epix Pro will display smartphone notifications from your phone, based on your phone configuration. Here’s one coming in here, showing emoji and all:

Garmin continues to expand the on-watch emoji support, where it’s now pretty rare to get any text that has unsupported emoji in it. If you’re on an iPhone, you cannot respond back from the watch, due to Apple restrictions. However, on Android you can. For iPhone users, you’ll be able to read the full message, or clear the message (marking it as read).
Next, there’s the new Redshift mode. This mode shifts the entire display into shades of red/black – sorta like you might see with some night-friendly displays. You access this via the controls menu, letting you quickly toggle it on and off. Additionally, you can have this be the default at night time, based on your sleep mode settings (e.g., the time it automatically puts the watch into sleep mode):


Here’s what it looks like:

While the Redshift is a nice touch, I honestly haven’t really had much use for it. The display is already super-dimmed in the night sleep mode (an even lower level of brightness than the lowest daytime level). But hey, to each their own!
Next, is the new weather overlays. Quirkily, this is within the Weather Widget, and not within the workout/activity modes. Thus to access this you’ll go down to the ‘Weather’ widget glance, then all the way down again within that to the overlays. There you’ve got four options for overlays: Precipitation, Wind, Heat, and Clouds. Here you can see the heat overlay:

You can then play an animation that looks ahead at the next several hours. Further, you can zoom in/out and pan around. Here’s the wind variant:

Now, as noted the big quirk here is that you can’t see this directly while doing an activity on the map page. Instead, you need to bounce out to the weather widget. To Garmin’s credit, they made this slightly better via the new ‘Recents’ feature which you can long-hold the lower-right button to access weather, and then go down a few screens to see it. And, handily, this will at least show your route if you have a route loaded (though, won’t match whatever zoom levels you had.
Finally, it’s worth noting that the charging speed has been significantly increased. You can add 10% battery in just 5 minutes, more than enough for just about any couple-hour GPS-enabled workout. Or, you can now charge to full in about an hour.

I did a test where I went from 5% at 9:56AM, and by 10:06AM it was at 25%. By 10:26AM (30 minutes) it was at 58%.. At 10:36AM it was at 75%. At 10:47 it was 87%. From there you get into typical 90-100% trickle charging realm. At 10:58AM it was 93%. At 11:07AM it was 96%. When I remembered again at 11:18AM it was at 99%.
I’ll cover actual battery burn/usage a bit more down in the accuracy sections. With that, let’s talk about the flashlight.
The Flashlight:

With the Epix Pro, the flashlight has arrived to the Epix camp. Previously, it was only available on the Fenix 7X and Instinct 2X, but now it’s available on not just all Fenix 7 Pro sizes, but also all Epix Pro sizes.
The flashlight might sound a bit Inspector Gadgety, but it’s probably one of the most useful day-to-day pieces of hardware upgrades you’ll find on the watch. The flashlight has three main modes:
A) General purpose white and red flashlight
B) Emergency strobe modes
C) Running-specific strobe modes tied to cadence
To use the flashlight in a general purpose mode, you can either double-tap the upper left button to instantly turn it on (at any time), or long-hold the upper left button to access the controls menu, then the flashlight option:


As you can see above, there are four levels of white-light, and one level of red-light. The white light at full brightness is basically the same as my iPhone 14 Pro in terms of brightness. It’s great. However, the red light is actually my most frequently used one, which is awesome for getting around in the middle of the night without blinding yourself (or others). And the cool part is the watch will remember your last flashlight mode – so I just double-tap and it automatically turns on the red light (the mode I use).


Sure, all of this is great and useful digging around in your tent – and I used it that way last summer in the Enduro 2 numerous times. However, it’s frankly just the most useful in day-to-day scenarios – such as when travelling in new hotel rooms and trying to find your way around at night.
Beyond the regular flashlight mode, there’s the strobe modes. These are also accessible via the controls menu as well:


Within that, you’ve got the following strobe types:
1) Blink
2) Blitz
3) Beacon
4) Pulse
5) Custom
Within the custom mode, you can change the mode type (Blink/Blitz/Beacon/Pulse), the speed (slow/medium/fast), and the color (red/white).
Finally, there’s running-specific modes for the flashlight, enabled within the Run (or sport) Settings. The idea here is to increase your visibility for others on the trail or roadways. These are similar to the strobe modes above, but with one added option – cadence:
1) Blink
2) Blitz
3) Beacon
4) Pulse
5) Cadence
Within those settings you can assign it one of the five modes above, as well as three enablement options: On, Off, After Sunset

This means that if you were to choose ‘Cadence’ as your option, and ‘After Sunset’ with it, then the flashlight would blink to match your cadence on runs only after sunset. The light is plenty visible quite far away (like a bike light), letting either vehicles (if on/next to a road), or perhaps other pedestrians/cyclists see you if on a multi-use trail.
You can also always just leave the flashlight on if you need to, to illuminate the trail ahead of you. And while that works in a pinch, it’s not exactly the best way to illuminate the trail because of your arm swing. But hey, if your flashlight dies – it’s better than nothing. In fact, I even used it in a pinch on a ride that went later than I expected – merely to let cars see/spot me more easily.
I think the flashlight is one of those features that, given a few years, we’ll see it on everything – beyond Garmin’s own offerings. For example, I could see the flashlight easily fitting into something like the Apple Watch Ultra range, or watches from Suunto or Polar. It’s just super effin’ functional and useful day-to-day, with just as much utility as the flashlight on your phone (if not more, since your hands are still free).
Sports Usage:

The Garmin Epix Pro has seen the biggest jump in sports profiles that Garmin has ever made, adding some 30 new sport profiles. This represents a shift in Garmin’s thinking on when to create new sport profiles.
Up till now, Garmin has largely only created sport profiles (such as running, mountain biking, standup paddle boarding, etc…) when there was unique sport-specific data to back it up. Meaning the running profile has Running Dynamics measuring running efficiency, and if you went water skiing, it’d measure the length of each one of your runs, and so on. While that was great, it started to increase frustration that other sports didn’t have any way to easily categorize their usage. Stuff like skating or basketball.
That’s changed now. With the Epix Pro & Fenix 7 Pro, the company has added 30 new highly requested profiles – with the bulk of them more simplistic. These are primarily used for categorization purposes, and don’t have any sport-specific data behind them. You can customize them as you see fit, like in the past, but there might not be unique metrics. Garmin says the goal is that they’ll look at usage data for these sport profiles, and then figure out which ones make sense to build out more fully with added data.
In any case, to start a sport, you’ll tap the upper right button, which shows the sports menu. The sports you’ll see initially are those that you’ve favorited (and you can customize/re-arrange/etc. this list):

Here’s the full list of sports profiles available on the Epix Pro & Fenix 7 Pro (note: the last few show up under ‘sports’, so I added them here too):
Hike, Run, Trail Run, Ultra Run, Treadmill, Virtual Run, Indoor Track, Adventure Race, Obstacle Racing, Walk, Pool Swim, Openwater Swim, Swimrun, Golf, Climb, Bouldering, Adventure Race, Fish, Hunt, Disc Golf, Horseback, Archery, Bike, Bike Indoor, MTB, eBike, eMTB, CycleCross, Bike Commute, Bike Tour, Road Bike, BMX, Strength, Cardio, HIIT, Yoga, Pilates, Elliptical, Stair Stepper, Row Indoor, Climb Indoor, Bouldering, Floor Climb, Boxing, Mixed Martial Arts, Ski, Snowboard, Backcountry Ski, Backcountry Snowboard, XC Classic Ski, XC Skate Ski, Snowshoe, Ice Skating, SUP, Kayak, Row, Surf, Kiteboard, Windsurf, Whitewater, Boat, Sail, Sail Race, Sail Expedition, Wakeboard, Wakesurf, Water Ski, Tube, Fish, Snorkel, Soccer/American Football, Basketball, Baseball, Softball, Volleyball, Cricket, Lacrosse, Rugby, Field Hockey, Ice Hockey, Ultimate Frisbee, Tennis, Pickleball, Padel, Racquetball, Squash, Badminton, Table Tennis, Platform Tennis, ATV, Snowmobile, Overland, Motocross, Motorcycle, Breathwork, Jumpmaster, Tactical, Anchor, Other, Tides, Anchor, HRV Stress, Project Waypoint, Health Snapshot, Reference Point, Broadcast HR, Tempo Training, ABC
Within each sport profile you can customize data pages with the data fields you want. You can have essentially an unlimited number of custom data pages, each with up to 8 data fields on them (even for all three sizes of watches, whereas only the Fenix 7X has 8 fields, the rest have 6 fields):

There are also standard data fields you can enable/disable for things like heart rate graphs, elevation plots, and maps. In fact, the Epix Pro & Fenix 7 Pro now have a few new data page types related to the map. The first is the ability to put data around the outer edge/perimeter of the map. You can customize the data fields you see on the edge:

And the second is the ability to split-screen the map with data fields, like below. You can customize each of these in all the spots you see data.

Further, you can also add either one or two (or zero) data fields atop the map page. Previously you had just one data field there related to distance, now you can tweak it how you see fit.
When it comes to sensors, the new units keep the same set of ANT+ & Bluetooth sensors as the existing Fenix 7/Epix units:
Headphones (Bluetooth), Heart Rate (ANT+/Bluetooth), Cycling Speed/Cadence Combo (ANT+/Bluetooth), Cycling Power (ANT+/Bluetooth), Running Footpod (ANT+/Bluetooth), Golf Club sensors, Garmin VIRB Action Cams, Tempe temperature sensors, Shimano Di2, ANT+ Cycling Shifting, ANT+ Cycling Lights, ANT+ Radar Sensors, Extended Display, ANT+ RD Pod, Muscle O2 (ANT+), XERO Laser Locations, Garmin inReach, Garmin DogTrack, Cycling Smart Trainer (ANT+), eBike
As in the past, you can save roughly 20 different sensors to the watch, as well as give them unique names. You can further enable/disable as you see fit (as well as delete). Note that in general, for dual-ANT+/Bluetooth Smart sensors (like power meters), you’ll want to use the ANT+ side, since it not only gives you unlimited channels on that sensor – but more importantly has more data in the stream than the Bluetooth equivalents. Only if you run into some sort of interference/connectivity issue with your environment should you swap over to the Bluetooth side.
With everything all configured, you’ll get ready to start your workout. If doing a structured workout, you can load that up. Same goes if doing some sort of navigation (which I’ll cover down below under the ‘Navigation & Routing’ section). Additionally, the watch will offer Daily Suggested Workouts for both Running & Cycling. These can be general in nature (without a goal), or can be driven by a specific goal race on your calendar.
If you put a specific running or cycling event on your calendar, it’ll automatically build out a pretty comprehensive training schedule – including multiple phases (e.g., base, build, peak, taper, recovery), as well as even offer which days you want your long runs/rides. You can see an example of one below:

The system is smart enough that if you’ve had crappy sleep or too much load from something not on the schedule, it’ll pull back the recommendations (or give you a rest day). Same goes for travel, if you’ve added your travel via the Jetlag Advisor feature.
In any case, regardless of whether you’re doing a scheduled workout or not, you’ll end up on this page, showing you the watch status before pressing Start. This shows GPS signal status, heart rate lock, any sensors paired, as well as any courses or workouts loaded:

Once ready, go ahead and tap the Start button to begin your suffering. To change data pages you can either use the buttons up/down, or swipe between data pages. Here’s an example of a few data pages during a recent trail run & hike:
![clip_image001[17]](http://media.dcrainmaker.com/images/2023/05/clip_image00117_thumb-1.jpg "clip_image001[17]")
![clip_image001[19]](http://media.dcrainmaker.com/images/2023/05/clip_image00119_thumb-1.jpg "clip_image001[19]")
![clip_image001[21]](http://media.dcrainmaker.com/images/2023/05/clip_image00121_thumb-1.jpg "clip_image001[21]")
If you’ve enabled LiveTrack, it’ll use your nearby phone to show your current location to a predetermined list of friends and family. Both my wife and I have our watches configured to automatically send an e-mail notification to the other person with our current location. This sends not only my exact location, but also things like heart rate, cycling power, pace, elevation, etc… And if you’ve loaded a course, it’ll show the loaded course as well.
During the workout you can either use auto-lap (such as based on distance) or manual laps. Or both. I tend to use automatic laps every 1km for my long runs, whereas I tend to use manual laps for other workouts like doing an interval workout (in fact, if a structured workout is loaded, it’ll automatically create lap markers for each section).
![clip_image001[25]](http://media.dcrainmaker.com/images/2023/05/clip_image00125_thumb-1.jpg "clip_image001[25]")
If doing something like a multisport workout, you can iterate from sport to sport using the lap button. In my case with Ironman 70.3 AIX-en-Provence two weeks ago, I used the triathlon mode but also button-lock. This ensured that a single lap button didn’t advance from swim to T1, or bike to T2. Instead, I had to briefly long-hold the button to unlock the watch, and then press lap to advance. It worked great – no issues. You can configure which legs auto-lock in the settings.

Note that with the Epix series (or any AMOLED watch from any company), if cycling with it, you’ll really need to be leaving it on your wrist. Sure, you can put it on your handlebars – and I’ve done that – but the display will automatically turn off when not on-wrist (even with always-on mode). On bumpier roads, it’ll actually stay on most of the time, but if you’re on beautiful smooth pavement, it’ll turn off to save battery and the display. Garmin says this is required to prevent a burn-in situation going wrong if left for many hours untouched. Though, I suspect if you’re a cyclist doing multi-hour workouts frequently, you’re probably going to have a dedicated bike computer.
![clip_image001[23]](http://media.dcrainmaker.com/images/2023/05/clip_image00123_thumb-1.jpg "clip_image001[23]")
Once your workout is complete, you can tap to pause it, and then again to save it. From there, you’ll see your efforts, including an outline of the map, training load, heart rate, and more. I did feel like things got a bit slower here somehow, in terms of enumerating some of these charts for longer workouts (e.g., 3-5hrs+). Just a few seconds, but something I don’t remember seeing in the past.
You’ll then see all this same data over on Garmin Connect, either the phone app or the website. Then from there, any workouts you’ve done will automatically sync to platforms like Strava, TrainingPeaks, and more – assuming you’ve configured as such. That typically happens within about 1 second of your workout syncing to Garmin Connect. Sync on the Epix Pro will occur via Bluetooth Smart, WiFi, or USB cable. The world is your syncing oyster.
So, once the workout is done, we can then dive into how that impacts all your training load and recovery metrics, things like Training Readiness, Training Status, and more.
Training Load & Recovery:

Next up are Garmin’s training load and recovery components, including Training Readiness and Training status. While these might sound similar, the reality is they have different purposes. Training Readiness is your overarching ‘Are you ready to train right this second?” number. Whereas Training Status is looking at the categorization and purpose of your training (e.g., is it too focused on aerobic vs anaerobic).
Within that, there’s a slew of different components that make up all the pieces. I’m going to throw all the terms here, but we’ll walk through it step-by-step, so think of this more as a reference:
Training Readiness: This metric aims to be your one-stop shop to decide whether or not to train that day. It blends Sleep (vs both short and long-term history), Recovery Time, HRV Status, Acute Load, and Stress. In short, you can spike one category (badly) without necessarily killing your next training day. But all categories aren’t created equal.
Training Status: This is looking at your acute load, HRV status, load focus, and VO2Max trends. This one is less about should you train, and more about how you’re training. Meaning, are you doing too much high intensity, or too much low intensity? That’s what’ll give you an unproductive status. In other words, how would a coach look at your training log, ignoring most other life/feeling type metrics.
HRV Status: This is measuring your HRV values constantly while you sleep, and then comparing it against your 3-week baseline, up to a 90-day rolling window baseline. A single night of drinking doesn’t tank this score, but three nights of partying won’t keep you in the green.
Acute Load: This is looking at your last 7 days of load, except the load now burns off dynamically. Meaning, a hard training day 7 days ago is far less impactful to the score than a hard training day yesterday. Previously this was called 7-Day Load, now it’s Acute Load.
Chronic Load: This is looking at the last 28 days of history, albeit like Acute Load, it’s weighted too within the 7-day chunks. The easiest way to think of it is essentially looking at the averaging of those Acute Load pieces for each of the last 4 weeks individually.
Load Focus: This shows which categories your training efforts have fallen into, over the last 4 weeks. These include Anaerobic, High Aerobic, and Low Aerobic. Basically, you need to have an even training diet to get faster. Simply running hard/all-out every day won’t make you faster. It’ll just get you injured and slower.
Recovery Time: This calculates how much time you need till your next hard-intensity workout. As is often misconstrued, this isn’t till your next workout, just your next hard one. This is largely the same as before. Exceptionally good sleep can speed this up, and inversely, a high-stress day can slow this down.
Chronic Training Load & Load Ratio: Chronic training load is simply the average of your 7-day training load chunks, but over the last 28 days. And Training Load Ratio is a comparison of this week’s Training Load versus that 28-day average. In other words: How does this week’s load compare to the last 28 days load?
There are many metrics here, some might say too many. But setting aside the quantity of them, most of them do actually have a purpose, even if confusing. If I were stepping back and looking at which ones to focus on, it’d essentially just be the new Training Readiness status. Before diving into that though, I’ve previously covered HRV Status components in my Forerunner 955 review here, so that’s a good place to dive into that component.
The idea with Training Readiness is to take a bunch of components under one umbrella, and figure out how ‘ready’ you are to ‘train’ at that very second in the day. The value will shift throughout the day (higher if you do nothing, lower if you do a workout). The score is comprised of all the fellows you’ve seen before: Sleep, Recovery Time, HRV Status, Acute Load, Sleep History, and Stress History:


Each of the components are weighted in varying ways, and against varying timeframes. Here’s the run-down:
– Sleep: This one is specifically looking at last night’s sleep
– Recovery time: This looks at your Recovery time in hours (based on workouts, but can be sped up with good recovery)
– HRV Status: This is comparing your 7-day trend versus historical trend
– Acute Load: This is looking at your 7-day trend, weighted towards newness
– Sleep History: This is looking at last night versus your prior 2 nights of sleep history
– Stress History: This is looking at the recent daytime data (excluding overnight readings)
Again, the entire purpose of Training Readiness is a live score of whether or not you’re ready to train at that moment in the day. The score will generally rise throughout the day (if just relaxing), and then following a big training effort, will plummet down (to reflect that recovery time). An easier training effort and it’ll shift down less.
The two biggest factors in your Training Readiness score are Sleep and Recovery time (workout recovery time). In fact, you can have low recovery time, but if you’ve got poor sleep – it’ll slaughter the score. Whereas HRV Status is meant to be a checks & balances type component to mitigate some of the others (both positively or negatively).

Outside of those two, the biggest component I tend to look at training-wise is my Acute Load. At first glance, you might think this is just 7-day Load renamed, but that doesn’t really cover what it actually does. Yes, it shows your 7-day load, but load burns off dynamically. In years past, if you had a big ride 6 days ago, that load would be factored into your total 7-day load duration as if it just happened yesterday. Versus with Acute Load, it’s weighted to burn-off within a few days, as is logical. That’s because a week later it’s unlikely that big ride is still impacting you. The point of this is to reduce the massive swings that used to occur in the Training Status panel when a big workout from a week ago disappears, making you go instantly from Productive to Unproductive in a matter of seconds.
Here’s my Acute Load. You can see the last two days are quiet, as I traveled across the pond on Saturday and landed Sunday. I haven’t worked out yet today. The green portion is my ‘tunnel’, which is basically my safe training load zone (high and low).

Next, by tapping down, you can see your Chronic Load and Training Load Ratio. Your Chronic Load is simply the average of those 7-day chunks, but for the last 28 days. It helps figure out whether you’re ramping up too fast or not. Previously this was somewhat visible in a different way via the ‘4 Week Load Focus’ page, but in a different categorization of load types. Now it’s a simple gauge:

If the two numbers (Acute and Chronic) matched exactly, that’d be 1.0. In my case, because of my travel the previous two days and not yet working out today – it’s below – at 0.8. Either way, it’s still in the ‘green’ as the green range is 0.8 to 1.5. This is also viewable in Garmin Connect Mobile.
Next, there’s Training Status. Training Status is the counterpart to Training Readiness. While similar sounding, they focus on different things. Training Readiness is more holistically looking at your sleep/stress (effectively your entire body), whereas Training Status is really focused mostly on just the training portion (with one aspect of HRV being pulled in for balancing it out). Overall, think of Training Status as trying to show whether or not the type of training I’m doing is beneficial to me getting faster. It’ll have messages like Productive, Unproductive, Maintaining, etc… Right now, I’m ‘Maintaining’, mostly because my Acute Load is on the lower end of the spectrum, and because my HRV Status is ‘Unbalanced’ from poor sleep with bouncing back and forth across the Atlantic these last few days.


On the bright side, my VO2max scores have finally unstuck in the last 6-8 weeks (after 6 months of seemingly being broken in Garmin-land, despite huge gains in fitness/training), so that’s positive – and means I actually see the ‘Productive’ messages. Garmin had been looking into things the last few months, so whether or not stuff was quietly changed under the covers, or if something else triggered a shift – I don’t know.

Next, there’s Recovery Time. Recovery time is showing your recovery time based on workouts. This is basically showing your recovery time till your next hard workout, in hours. This can speed up with a good night’s sleep, or slow down with crappy sleep or a very stressful day:

Beyond Recovery Time, Acute Load, and VO2Max – Training Status also accounts for Load Focus (how you divide up your training), HRV Status, Heat Acclimation, and Altitude Acclimation.
In general, when looking at Garmin’s various training load/recovery metrics, I find the Training Readiness component the most useful, alongside Acute Load. For the most part, if Training Readiness is in the red, I likely feel that way too – and am probably kaput on my ability to go out and do a hard interval workout (either due to lack of sleep or workout recovery time).
Whereas inversely, for Training Status, I find that to be a bit more finicky, and often less representative of where my training is (e.g., productive/maintaining/etc…). Ultimately, for Training Status especially, Garmin is in effect replicating what a coach would do. And like any real-world coach, different coaches have different training philosophies. You may agree or disagree with one style, and this is simply one style of coaching.
Hill Score & Endurance Score:

Garmin has introduced two new metrics with the Epix Pro & Fenix 7 Pro: Endurance Score & Hill Score. These two new scores are designed to help you compare your overall training load and mountain climbing prowess with friends. Or quickly demonstrate your lack thereof.
Starting off with Endurance Score, the goal here is to look at your entire training load – but in a way focused more on duration than intensity. Further, unlike Garmin’s other training load metrics (or even VO2Max), Endurance Score is sport-agnostic. Meaning that most of Garmin’s other metrics are heavily skewed towards running and cycling. But Endurance Score can be used to track progress in ice skating or swimming, or whatever you want.
Your Endurance Score looks at your overall activity duration in conjunction with the intensity level. The longer the better, but at the same time, intensity plays a part, and in particular, intensity relative to your VO2max. However, the idea is that your Endurance Score is comparable with other people. Here’s mine below:

You can see your historical Endurance Score, though how much you see is super variable on a painful amount of Garmin platform wonk. Basically, the first time you use the watch, it’ll pull your previous 30 days of historical data (maybe, that too depends on which watch you had). And then populate the graph.
Why on earth they can’t pull 90 days is beyond me. Garmin says it’s because they calculate it on the watch, and that’s resource intensive (both transferring the files to the watch, and then calculating). To which I say: Isn’t that the entire flipping reason you just spent a year re-architecting Physio TrueUp to be Unified Training Status? And isn’t that why you bought FirstBeat – to make this all seamless?
Making matters worse, at present, if you reset your watch for any reason, this too resets back to that 30 days of history. This below picture illustrates this incredibly well, with various watches in various states of recent resetting or being added to my account;

To Garmin’s credit – after my incessant battering on this issue the past month or so, they agree this isn’t ideal – and are looking at ways to make this not suck. But it’s still frustrating. At the very first opportunity for a new feature after Garmin rolls out Unified Training Status, it goes out the window. Both Endurance Score & Hill Score. Seriously, any new feature shouldn’t be launched unless it’s fully supported in UTS for the full historical duration of whatever chart it has.
Ok, tangent aside – let’s talk about scores and relativity.
Garmin says that there’s no technical ‘limit’ to an Endurance Score per se. They noted they have some “internationally competitive” (read: pro) Ironman triathletes that have scores in the 11,000 range. However, they also noted that they think it’d be difficult to reach beyond 12,000. Not impossible, but likely pushing the limits of human physiology (at least, in a non-doped realm).
For further context, my Endurance Score the last 1.5 months or so has floated in the 8,000-8,200 range on about 8-14 hours of training per week, mostly in the Zone 2 (HR/Z2) realm. Sometimes higher or lower in duration or intensity, but that’s the rough realm. Meanwhile, my wife’s score has been in the 9,000-9,200 realm as she peaks her training for an endurance event later in June. Her training load is in the 12-15 hours/week range – again, heavily focused on the Z2 intensity.
The problem is that I’ve had numerous days where the Endurance Score changes simply haven’t made sense. One in particular was where I did a 2 hour trail run (with huge elevation gain) and the score literally did nothing (moved from 8,075 to 8,077). Yet, later that same day I did a super chill/easy 30-minute openwater swim, and it spiked from 8,077 to 8,114. Why? The heart rate showed a reasonably low value – yet Endurance Score had a major pop.
![clip_image001[1]](http://media.dcrainmaker.com/images/2023/05/clip_image0011_thumb.png "clip_image001[1]")
![clip_image001[3]](http://media.dcrainmaker.com/images/2023/05/clip_image0013_thumb.png "clip_image001[3]")
![clip_image001[5]](http://media.dcrainmaker.com/images/2023/05/clip_image0015_thumb.png "clip_image001[5]")
I wish I could see better historical data here, to see how things trend better in various scenarios – but, that’s what we’ve got to work with.
Next, there’s Hill Score, which is all about running/hiking/walking. No cycling is accounted for here. Hill Score has two core components to it, based on climbs with gradients of 2% or greater:
Hill Endurance: This first component is focused on going long, or rather, going high. Distance over speed – the longer and higher you go, the better. So a very long mountain day would spike this more than your weeknight hill repeats would.
Hill Strength: This second component is aimed at how fast you can go up a given pitch. So something like hill repeats would help here, assuming you were pushing a bit.
In addition, your current VO2Max is also utilized as a foundational element for determining your score. For the initial Hill Score instantiation, you need about two weeks of data. Albeit, that can be jumpstarted with other higher-end and recenter firmware Garmin devices like an existing Fenix 7 or Forerunner 965. Till then you’ll just get a message to keep running.
Note that this feature is not using running power under the covers, nor is it using straight pace or GAP (grade-adjusted pace) either. Instead, Garmin says that while the exact details are a “trade secret”, they said that they’re looking at similar relationships between running power and GAP, but that running power isn’t a great method for this score because you can have the same running power on an incline as the flats. And the flats isn’t helping you build any hill endurance. Likewise, GAP doesn’t take into account any heart rate component – and HR is a component leveraged in relation to VO2Max (up to a point they said).
In my case, my initial Hill Score data point actually came in conjunction with doing an 8,000ft trail run/hike. I started from the sea, and went to the top of an 8,000ft snow-capped mountain in one go (the one you see in the background of the first photo), taking about 8 hours:
![clip_image001[9]](http://media.dcrainmaker.com/images/2023/05/clip_image0019_thumb.jpg "clip_image001[9]")
![clip_image001[5]](http://media.dcrainmaker.com/images/2023/05/clip_image0015_thumb-1.jpg "clip_image001[5]")
![clip_image001[7]](http://media.dcrainmaker.com/images/2023/05/clip_image0017_thumb.jpg "clip_image001[7]")
This resulted in a rather interesting initial result – 85 – a very very very high Hill Score (I had one other hilly run a few days prior, but all remaining time was spent in Amsterdam on flat ground):
![clip_image001[1]](http://media.dcrainmaker.com/images/2023/05/clip_image0011_thumb.jpg "clip_image001[1]")
![clip_image001[3]](http://media.dcrainmaker.com/images/2023/05/clip_image0013_thumb.jpg "clip_image001[3]")
The available categories are:
![clip_image001[7]](http://media.dcrainmaker.com/images/2023/05/clip_image0017_thumb.png "clip_image001[7]")
Garmin says that your grading is “relative to others of the same age and gender, ensuring the progress you see is personally meaningful”. The challenge I have here is that I’m not a near-pro level hill runner. I mean, yes, I have lots of ‘endurance’ (or, stupidity as it was here). But I don’t think anyone would say that I’d be anywhere near a world-class level trail runner. Or even someone that does ultra running on the regular in the mountains. So for me to end up effectively on the podium on my opening game, is a bit suspect.
Unfortunately, Garmin isn’t really sure why I scored that high either. They agree that the initial 8,000ft climb was likely being overly weighted in the calculations. After doing that climb and a few others on that trip, my score slowly decayed down to 77. I was able to keep that score from decaying at the previous rate by doing another big 6.5 hour hike/trail run in the mountains – adding another 4,000ft or so of elevation.

In my mind, the jury is still heavily out on this feature. I’ll be interested to see how others fare over the coming months in terms of Hill Score and how much mileage/speed/etc you’re putting up. In my case, while I have recorded good Hill Strength (the speed part), I suspect that too might be heavily influenced by just how long I can sustain a climb at a fast-hike level.
While I’m not great at ‘running’ up mountains, I’d say I’m very efficient at doing so for long periods of time – and can do so for durations that are far beyond what most would bet I could do. For whatever reason, that’s my sweet spot. Last fall, without any background trail running/training, I went out and did the first 70KM of the UTMB course in the mountains in one 14hr shot (testing the Apple Watch Ultra). This was with a heavy pack of gear and just enjoying the beautiful fall day. This had 13,146ft of elevation gain by the time dinner came around (here’s the activity, in this case also on a non-Pro Epix unit).
My point is, perhaps I do have some mountain climbing talents that manifest itself well in the Hill Score values, even if I think they don’t at all compare to a true ultra trail runner.
While most of the time I can decode and fully understand the various metrics Garmin makes, this time with these two metrics – I’m still a bit in doubt. If we look at things like Training Readiness, or even the often quirky Training Status – I can generally understand the methodology behind how they arrived at a score. Sure, I might not agree with that coaching philosophy (since, it is in effect a coaching philosophy) – I can at least connect the dots and say ‘Sure, that’s not my cup of tea, but it’s a largely valid cup of tea’.
This time though, with these two scores – there’s shortcomings that seem hard to connect. I think Endurance Score is reasonably in the ballpark of things for me (minus some of the per-activity quirks I saw), whereas I think Hill Score is a bigger outlier.
Navigation & Routing:

The Epix Pro & Fenix 7 Pro series have full onboard mapping and routing/navigation features. This means that unlike virtually all of their competitors, they can route free-standing using the data contained in their maps, without a pre-loaded course. Albeit, how often you actually do that in real-life will vary quite a bit (virtually never for me). Still, it is notable. Further, the maps in the Garmin devices contain details like street/trail/lake names as well as other points of interest labeled on them, which again, virtually none of their competitors contain.
The Epix Pro & Fenix 7 Pro units in particular now feature shaded relief maps (though existing Fenix 7/Epix units get that via firmware update). Interestingly, this doesn’t actually increase the map size. Rather, this is done using existing data in the maps data sets.
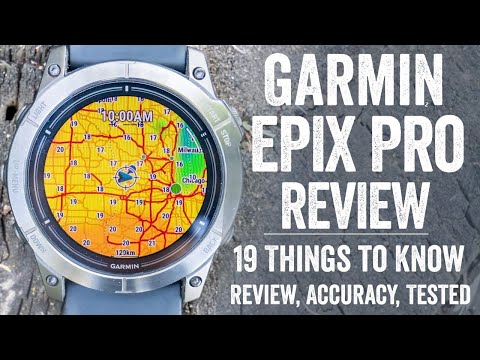
By default, your unit will come with preloaded maps for the region you bought it in (with free downloadable maps for all other regions). All Epix Pro & Fenix 7 Pro units have 32GB of storage now, which is plenty for not just maps, but also music and basically thousands of hours of workout recording. Here’s a quick look at the current sizes of the main downloadable map regions:
TopoActive North America: 9.1GB
TopoActive Europe: 10.4GB (*See update below for added Europe breakout)
TopoActive THID: 2.0GB
TopoActive Middle East & Central Asia: 1.3GB
TopoActive Australia & New Zealand: 1.8GB
TopoActive Africa: 4.6GB
TopoActive Japan: 3.9GB
TopoActive Hong Kong & Macau: 19MB (yes, megabytes)
TopoActive South America: 6.2GB
TopoActive Taiwan: 107MB
TopoActive Korea: 229MB
TopoActive SGMYVNPH (Singapore/Malaysia/Vietnam/Philippines): 1.3GB
TopoActive China Mainland: 6.6GB
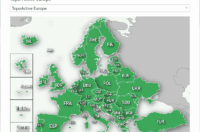
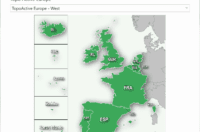
In addition, in Europe, Garmin has also broken things out further, if you want smaller chunks. These overlap somewhat, to make it a bit easier to get the region you want. Alternatively, you can just download all of Europe per above:
Europe Whole: 10.4GB
Europe West: 6.8GB
Europe Central: 6.4GB
Europe East: 6.2GB
Here’s how the map region breakouts for Europe look:

To change which maps are on your unit, you can go into settings > Maps > Map Manager. This lets you add/remove maps via WiFi. Alternatively, you can do this via USB and the Garmin Express app. All of these maps are free to download.

There are also maps listed as Outdoor Maps+, these are paid subscription maps, mainly for satellite imagery. Garmin has actually long offered that under the ‘Birdseye’ branding, but recently rebranded that under the Outdoor Maps+ branding. Said differently: No, Garmin isn’t now trying to charge you a fee for something that was previously free. Instead, that’s rebranding something that Garmin has literally been doing for more than a decade. I hate subscription fees as much as the next guy, but this isn’t the thing to complain about (in fact, it’s a heck of a lot better than before, which required some stupid software on your computer to transfer over – now you can do it straight from the watch).
Once you select a map on the unit, it’ll start downloading once connected to a charger. In general, this is not a fast operation. Whereas via USB with a computer, it goes far faster. Basically, the WiFi chipset/antenna on the watch isn’t really designed for big-bandwidth operations (it’s designed for power efficiency). Thus by using a computer you can download a ton faster.
In any case, when it comes to courses/routing, you can create courses in a million different places/ways. Be it on Garmin Connect, Strava, Komoot, GPX creators, etc. All of them ultimately end up with the course showing up under ‘Navigation’ on the Epix or Fenix series. Here’s your full list of options (to navigate):
A) Point of interest
B) Around me
C) Back to Start
D) Courses
E) Activities
F) Saved Locations
G) Sight ‘N Go
H) Coordinates
I) Use Map
In the vast majority of cases, you’re going to be using a pre-loaded course. These are courses you create, as noted above, via either Garmin Connect or 3rd party platforms. In my case, I created this route via Strava, and then synced it to the Epix Pro:

From there, you can look at overall details about the route, including climbs, elevation profile, and map. You can also reverse it. And of course, you can load it up to start it.


Once a course is loaded you’ll get prompts for turns as you approach them. For hiking/running/etc it’ll be about 50 meters out, and for cycling it’s about 150 meters out. You can see this here as I hike up an 8,000ft mountain on a 35km or so route:
![clip_image001[11]](http://media.dcrainmaker.com/images/2023/05/clip_image00111_thumb.jpg "clip_image001[11]")
![clip_image001[13]](http://media.dcrainmaker.com/images/2023/05/clip_image00113_thumb.jpg "clip_image001[13]")
It’ll notify you on any data page, so you don’t have to stay on the map page. I can use the map page with my finger (touch), or use buttons, if I want context for things around me. If you go off-course, it’ll notify you of such. You can re-route if you want to (using the underlying map data), though by default it won’t re-route you – it’ll just let you know you’re still off-course.
Note above the shaded relief on the maps, that’s the greyish area. Here’s another look at it, side-by-side with the Fenix 7X Pro (at right):
![clip_image001[15]](http://media.dcrainmaker.com/images/2023/05/clip_image00115_thumb.jpg "clip_image001[15]")
However, when I’m doing longer climbing routes, I’m typically going to stay mostly on the ClimbPro page. ClimbPro will automatically determine the climbs based on your route (some route has to be loaded, even if created on the watch). You’ll see the full list of climbs, and then each individual climb as you’re on it:

As you plod along, it’ll show you how much distance/elevation to the top, and your ascent rate. There’s also a profile of the climb itself. As I’ve said many times, it’s one of my favorite Garmin features. Especially for crazy big mountain climbs like this where knowing not just how far it is to the top distance-wise, but also how much vertical is remaining (since that will vastly impact my speed).
Ultimately, there’s no watch out there that comes close to Garmin in the navigation/routing realm. The closest you can get today is some of the 3rd party apps on the Apple Watch (as natively Apple doesn’t offer navigation/routing today), though that tends to be a bit more scattershot in terms of features. And likewise, while companies like Suunto/COROS/Polar have navigation, they don’t have underlying routable maps (and mostly don’t have map data like road names/trail names/etc…) Meaning if you do want to do on-demand routing between two points from the watch alone, you can’t do that. Albeit, as noted above, it’s very rare that I do that. I’ve almost always got a route planned ahead of time.
GPS & Elevation Accuracy:

There’s likely no topic that stirs as much discussion and passion as GPS or heart rate accuracy. A watch could fall apart and give you dire electrical shocks while doing so, but if it shows you on the wrong side of the road? Oh hell no, bring on the fury of the internet!
GPS accuracy can be looked at in a number of different ways, but I prefer to look at it using a number of devices in real-world scenarios across a vast number of activities. I use 2-6 other devices at once, trying to get a clear picture of how a given set of devices handles conditions on a certain day. Conditions include everything from tree/building cover to weather.
In this case, the Epix Pro & Fenix 7 Pro units are all configured for so-called ‘SatIQ’ or AutoSelect mode, which means they’ll use Multiband GNSS when necessary – like under a cliff overhang (the best possible GPS/GNSS configuration), and then tone it down to other modes when unnecessary (such as across a farm field). This massively helps the battery life, as most times you don’t need multiband GNSS. The other units are configured as noted.
In my case, I’ve got nearly two months of data here – so I’m just gonna kinda pick and choose some of the hardware – because spoiler, virtually everything is perfect (as has been the case on virtually all of Garmin’s new multiband GNSS devices the last 18 months). Nonetheless, we’ll nitpick for the sake of nitpicking! However, it does demonstrate just how far ahead Garmin is to every competitor out there, especially when details matter. You can easily see this in the more challenging situations below.
First up, we’ve got an ‘easier’ run through the woods and around the rowing basin of Amsterdam while doing 8×1-minute intervals. I mean, I suppose it was easier for the watch – less so for me. This is the Epix Pro, Suunto Vertical, and Forerunner 965. Here’s that data set, it’s boringly perfect:

About the only time we see some brief variance is mostly from the Suunto Vertical (blue towards the left), however we do see the Epix Pro seem to meander a meter or two off-track briefly in one early section.

Next, we’ve got another Amsterdam run, this time more in the woods, doing a tempo run. This has the Epix Pro & Fenix 7 Pro, along with the COROS Vertix 2. At a high level, things look OK from all units:

As you can see above, at a high level it looks pretty similar. But as you zoom in, within the woods you can see the COROS Vertix 2 meanders quite a bit. The Epix Pro & Fenix 7 Pro are virtually identical on-track:

This is somewhat typical of the Vertix 2, never quite nailed (even in multiband as it is here). You can see it straight-up cuts across the top of the hill, and is offset in the trails:

Along with cutting this corner here too, whereas the Epix Pro & Fenix 7 Pro units are spot-on.

Now let’s increase difficulty, this time a trail run in deeper woods. It starts off on pavement, and then shifts to the trails. I’ll ignore the pavement portion, since that’s boring (and perfect). This is the Epix Pro compared to the Suunto Vertical, Apple Watch Ultra, and COROS Vertix. Here’s that data at a high level:

As I traverse across the expanse of woods, you can see the Apple Watch Ultra & Epix Pro are very closely aligned, alongside usually the Suunto Vertical. Occasionally, the COROS Vertix 2 meanders a bit.

You can see that classic COROS Vertix 2 meandering below in harder GPS conditions, whereas the other units are spot-on each other (and where I actually went):

And again here as well:

For fun, here’s the elevation plot for that run – with a bit more separation than I’m used to. In all my elevation tests, I let GPS handle auto-calibration, and a unit has to get it right by itself. In this case, I had calibrated the Suunto a day prior near the beach. Albeit, it still drifted downwards slightly, and was below actual starting elevation slightly. You can see the COROS was substantially below sea-level despite starting a few meters above sea level. The Garmin and Apple Watch Ultra were in the rough ballpark of about 5-8m starting elevation.

Again, we’re now going to increase the difficulty level. This time a mountain hike from the sea to the top of an 8,000ft mountain, alongside massive cliffs and in deep forest canyons. Here’s that data, with that somewhat hard to see set of lines on the map:

As I plod through the woods, you can see all the units are actually very close to each other here. This would be the Epix Pro, COROS Vertix 2, Suunto Vertical, and Amazfit T-Rex:

Same goes for this very challenging situation, GPS-wise. Here’s the same map section, but showing it with two different layers:


If you really zoom in on some of these sections, it’s where you notice the imperfections of other units – such as the Amazfit T-Rex Ultra here in green, meandering off-track a bit. Though, I’ll note that the Amazfit T-Rex and COROS Vertix 2 were looped onto the backpack on this particular hike, rather than wrists/hands. In general, it probably helped them, because they’d been on the back facing the sky the entire time. But hey, I just want to be clear one way or another. Of course, as seen below (and as usual) – sometimes you just can’t give enough assistance to the T-Rex Ultra.

And as I climb towards the top over snowfields, all the units converge back to reality and snap together very tightly:

Again, here’s the elevation plot for that hike:

So, the question is – how close to the final elevation did the four units get? Here’s what it says the elevation is at the top:

And then here’s the elevation listed when I hit stop at the top, according to the files:
COROS Vertix 2: 2,353m
Suunto Vertical: 2,355.9m
Garmin Epix: 2356.2m
Amazfit T-Rex Ultra: 2354.15m
All four watches are within 2 meters of each other. I’d assume the listed altitude on the building would be at ground level, but then again, maybe it’s actually where the numbers are? I don’t think there’s any portion of the mountain higher than the building. Either way, for all watches to be that close is fairly darn impressive.
Next, another trail run/hike, this time along the cliff-laden coast of France in a national park there. Here’s the data set from that, comparing the Epix Pro 51mm with the Fenix 7X Pro, as well as the COROS Vertix 2, Suunto Vertical, and Forerunner 965. The last three being snapped on the backpack facing the sun. You can see the route starting in Cassis, and ending in Marseilles:

Just to show how good these tracks are (from all units actually), I’m gonna show both variants of the map so you can see the cliffs and such:


However, here’s a really good example of just how much better Garmin’s implementation of multiband/dual-frequency is. Below is a cliff face that I’m going to hike under the edge of – all the way across as far as you can see in this image. Scale is tough to understand, but the boulders you see down below are as big as me. In some sections the cliff is over me entirely.

Now, here’s the GPS tracks from that. Note the Garmin ones are clustered much closer against the wall and together, versus the others are a bit more wobbly out further away. In the grand scheme of things this isn’t a huge deal, but it demonstrates it well.

And one more final section showing how good the tracks are:

Finally, here’s the elevation plot. Notably, the FR965 track seems to be more ‘smoothed’ for some reason, including a section while I went to jump in the ocean to cool off, and it randomly rose a bit (despite that unit sitting on the beach on my backpack). Meanwhile, the Vertix 2 also seemed to be undercutting at times. In any case, the Epix Pro & Fenix 7 Pro seemed spot on with the Suunto Vertical.

Next, let’s look quickly at a couple of rides – both gravel and road. Here’s a gravel bike ride I did this past week, with the Epix Pro 51mm and Fenix 7X Pro, compared to the Hammerhead Karoo 2 bike GPS:

You can see that everything is very tight together:

Even in the woods, albeit, here you see a bit of meandering from the Hammerhead Karoo 2:

Looking at the elevation there, we do see some slight differences and drifting from the different units. This ride didn’t exactly start/end at the same place – so using that as a reference isn’t exactly correct. Either way, we do see some differences here of a few meters.

Next, here’s the bike portion of my Ironman 70.3 race two weekends ago. I’ll pick some sections that were more challenging GPS-wise, such as this here. We can see it’s virtually identical between the Epix Pro & Fenix 7 Pro, versus the Garmin Edge 840:

This twisty-turny mountain descent was also nailed by the two wearables, and oddly, the Edge 840 was the one slightly off:

But these other areas here look all spot-on:

And while I don’t have a 3rd data source for the openwater swim, I think we can all agree this looks incredibly perfect. And by that, I’m referring to my awesome swimming straight capabilities – who cares about the watches:

It’s funny to look at the transition (T1) GPS lines, you can see here where I stopped to grab my bike:

Finally, one last one. I’ve got tons of openwater swims, and frankly, they’re all the same – very very strong. Here’s one of many from Turkey (there’s a ton more in my Suunto Vertical In-Depth Review GPS-section, if you want). This is compared to a swim buoy reference track that floats along with me:

With that, as you can see, the GPS/GNSS accuracy is spot-on with the Epix Pro & Fenix 7 Pro series, and easily industry-leading. About the only company that’s putting up similar-level GPS tracks is Apple and the Apple Watch Ultra with multiband. Behind them is the Suunto Vertical, which has a rough time in openwater swimming, but does quite good in land activities with dual-frequency/multiband (albeit, has some very minor quirks from time to time). Then further down the list is COROS Vertix 2 with multiband, showing more errors in challenging conditions.
In terms of battery life, I’ve got lots of interesting charts – but the takeaway here is the Epix battery life is super impressive – especially the Epix Pro 51mm. Here first is a 6.5hr hike (with navigation enabled, and always-on display), where you can see the Epix Pro is on track for 50 hours of battery life. The Fenix 7X Pro? Only slightly more at 54 hours. Both in SatIQ mode. Note the FR965 was forced to multiband here, hence the lower battery life.
![BatteryChart_thumb[1]](http://media.dcrainmaker.com/images/2023/05/BatteryChart_thumb1_thumb.png "BatteryChart_thumb[1]")
Here’s my Ironman 70.3 race, where both units were used in the swim, then bike (with power meter), and then finally the run. Optical HR sensor for all of them, always-on for both. You can see the Epix Pro 51mm was on track for 45 hours, while the Fenix 7X Pro was on track for 48 hours.
![BatteryCharge2IM_thumb[1]](http://media.dcrainmaker.com/images/2023/05/BatteryCharge2IM_thumb1_thumb.png "BatteryCharge2IM_thumb[1]")
Then there’s a gravel-bike ride, where both units were connected to power meters as well as electronic shifting. Here we see a bigger jump from the Fenix 7X Pro, likely due to the very sunny conditions.

Still, these numbers are impressive on the Epix side especially! I’ll add in some more regular Epix Pro 47mm and Epix Pro 42mm battery charts shortly.
(Note: All of the charts in these accuracy portions were created using the DCR Analyzer tool. It allows you to compare power meters/trainers, heart rate, cadence, speed/pace, running power, GPS tracks and plenty more. You can use it as well for your own gadget comparisons, more details here.)
Heart Rate Accuracy:

Before we move on to the test results, note that optical HR sensor accuracy is rather varied from individual to individual. Aspects such as skin color, hair density, and position can impact accuracy. Position and how the band is worn, are *the most important* pieces. A unit with an optical HR sensor should be snug. It doesn’t need to leave marks, but you shouldn’t be able to slide a finger under the band (at least during workouts). You can wear it a tiny bit looser the rest of the day.
Meanwhile, for HR accuracy testing, I’m typically wearing a chest strap (either the Polar H10 or the Garmin HRM-PRO Plus), as well as another optical HR sensor watch on the bicep (often the Whoop 4.0 band). Note that the numbers you see in the upper right corner of the charts below are *not* the averages, but rather just the exact point my mouse is sitting over. Note all this data is analyzed using the DCR Analyzer, details here.
First up we’ve got a nice tempo run to kick things off, showing the increasing steps of heart rate throughout. This has the Epix Pro (47mm) vs the Fenix 7 Pro (47mm), compared to an HRM-PRO Plus, here’s the data:

As you can see, it’s very very close. A tiny bit of latency at the very beginning for a few seconds, and then one brief bobble around the half-way marker for no obvious reason, but otherwise, both units were very close to the chest strap.
Next, we’ve got a trail run, including some hard mountain inclines and a fast running descent. This is comparing the Garmin Epix Pro (51mm) to the similarly-wised Suunto Vertical, and then a chest strap.

As you can see, the Suunto struggles a bit here and there, but the Epix Pro manages to come out very close. Running downhill fast is actually really hard for optical HR sensors, and it does well throughout. Below is one section as I ascend, and you can see a tiny bit of latency in some cases from the Epix Pro, though usually only a few seconds. The Suunto Vertical is slightly more latent than that.

Next, we’ve got an interval run. These are 8×1-minute borderline all-out intervals. This is very hard for optical HR sensors, and we can see the fallout from that, when compared to the chest strap. The Suunto Vertical essentially gives up before it even starts, and the Whoop 4.0 optical HR sensor is equally annoyed as the situation, being low-offset much of the time. The Garmin Epix Pro manages to hold on throughout most of it, though does struggle on interval #3 (entirely missing it), as well as undercutting intervals #1/2 a bit. The other intervals were pretty good though.

Next we’ll take a look at the heart rate during my Ironman 70.3 (bike portion) on a triathlon/TT bike. I don’t have a comparative recording device for the run/swim (meaning, not a 3rd watch to record the chest strap data), so no point in looking that. Whereas for the bike, I had the bike computer record from the chest strap. Here’s those results:

As you can see, the first half or so, the results were fairly close. Better in the first 1/3rd, but still, pretty darn good for riding in rainy conditions on occasionally bumpy roadways. Optical HR during cycling is still very challenging for many watches.
Where you see it struggle a bit more though is the lower-HR sections, when I’m descending bumpy roads and holding tightly on the handlebars (watching my competitors fly across into the woods and worse, in the horrible conditions). That’s where you see the most variation, and that holds true here too.
Next, we’ve got a gravel ride from this past week, on a gravel bike (in a road-style handlebar setup). I note the handlebar design, because it makes a difference when it comes to accuracy for most users, since the wrists strain differently between a triathlon bike and a road bike. Here we can see that, on the whole, things are pretty darn close. Though, we have a few moments where the blue-line of the chest strap drops below.

Curious, I dug into those blue-line drops, and could see that in all those cases, I had stopped pedaling (coasting) – perhaps due to the rolling terrain, or the group of people with me, or maybe I just wanted to eat a Slim Jim. Who knows. But, that pedal-stopping action naturally drops my HR, and we can see it drop far faster on the chest strap than the Epix Pro (51mm) or Fenix 7X Pro. This is fairly normal to see on optical HR sensors, and why they tend to do better in steady-state riding than interval-type efforts outside on the road – especially bumpier gravel conditions like this:

By and large, this is Garmin’s best optical HR sensor to date. Between all my Epix Pro & Fenix 7 Pro datasets, it’s very very good, in all sizes. However, the changes are especially notable in cycling, where it’s right more than it was in the past. Historically, we’ve seen more incorrect spots, whereas now, it’s very good the vast majority of the time in mostly normal conditions. In cases like cold wrists descending wet mountain passes holding on for dear life, we see it still struggle. Likewise, as seen above, we see a bit of latency on bumpier roads where it’s trying to denoise everything.
Still, for the most part I can trust it in most of my training – especially running, indoor cycling, and road-riding outdoors that’s more steady-state, to be largely correct and dependable. As always, with optical HR sensors, environmental & terrain conditions, your skin, and other factors can and will impact accuracy. But, it continues to improve, one iteration at a time.
Wrap-Up:

The Epix Pro is a nice little bump in specs compared to the existing Epix. For many people, the choice of three sizes is a huge difference in terms of choosing between Epix and a different watch. That by itself will be seen by some as a massive upgrade (and rightfully so). Likewise, the addition of the flashlight across the board on all three units is super handy, and a favorite of many on the existing Fenix 7X, Enduro 2, as well as Instinct 2X. And of course, the added multi-band GNSS continues to keep Garmin at the front of the pack when it comes to GPS accuracy.
For other features and upgrades, the state is a bit more jelly-like. For example, the new optical HR sensor package is very solid in terms of heart rate accuracy in my testing. Spot-on. However, at present Garmin hasn’t lit-up features like ECG, or skin temperature monitoring (the latter of which can be used in women’s health tracking in particular). If or when that occurs remains anyone’s guess. Obviously Garmin is limited in saying anything with respect to ECG due to FDA limitations, until FDA clearance occurs. Though, at least the hardware is in there today (unlike the existing Epix/Fenix 7 watches). And on the software side, I’m curious to see how people’s experience is with Hill Score & Endurance Score. I think the Endurance Score is reasonably good overall (with only minor quirks), but Hill Score for me specifically, seems pretty suspect.
In that same vein, areas like the weather overlays (pictured above) are great, but just misplaced. I have zero use for them within the normal weather widget. And while the new ‘Recents’ option to quickly get back to the weather widget is handy, I still feel like the lack of having the overlays directly on the maps I use to navigate/route seems like a crazy omission. Perhaps Garmin is concerned about balancing battery life there, but still – I think there’s a better way of handling that concern (perhaps in the same way they constantly proactively nag you to consider turning off the Always-On display every time you unplug the Epix Pro from a charging port).
Nonetheless, other areas like the expanded sport profiles, the new data pages, and even the split-screen data pages are pretty cool. And same goes for Redshift, if that’s your (strawberry-tinted) jam.
Overall, I appreciate Garmin didn’t raise the prices here, but instead just added a boatload more features – both hardware and software to the Epix. And even more, I appreciate that all the new software features I talked about here, are going back to the existing Epix as well. Kudos to Garmin on that one, since that hasn’t always been the way they handle things.
With that – thanks for reading!